17 Jun 2026
Tracing Microtransaction Rarity Curves Against Retention Metrics in Gacha-Adapted Console RPGs Across Mobile and PC Platforms
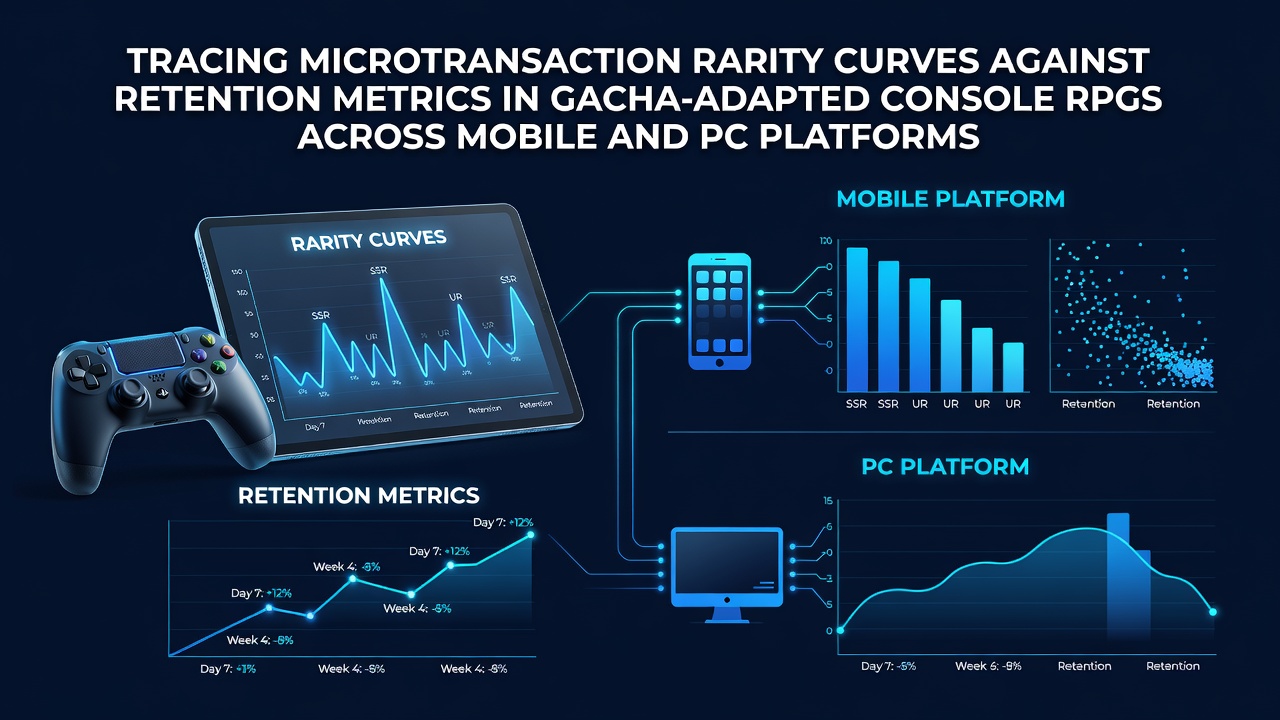
Analysts track microtransaction rarity curves by mapping drop probabilities for items of varying scarcity against player retention data collected over multiple update cycles in gacha-adapted console RPGs and the patterns emerge when developers adjust pity timers or banner rotations while monitoring daily active user counts alongside churn rates across mobile and PC builds.
Defining Rarity Curves in Practice
Teams calculate rarity curves through probability distributions that assign percentages to common, uncommon, rare and ultra-rare rewards and these distributions shift when studios introduce limited-time banners or step-up systems that alter perceived value for players who engage with microtransactions regularly. Observers note that steeper curves concentrate rewards at lower probabilities which forces longer play sessions before high-value items appear and flatter distributions spread access more evenly yet still tie progression to repeated pulls.
Data Collection Methods Across Platforms
Researchers compile telemetry from mobile clients that record session length and purchase frequency alongside PC client logs that capture similar metrics yet account for differences in input methods and screen sizes and cross-referencing these datasets reveals how rarity adjustments influence week-over-week retention when players reach specific progression gates. Studies released in June 2026 highlighted correlations between banner-specific drop tables and 30-day retention figures in titles that migrated gacha frameworks from mobile origins to console releases and the figures showed mobile cohorts responding faster to pity system tweaks while PC groups sustained engagement longer when visual fidelity updates accompanied rarity changes.
Retention Metrics and Their Link to Drop Probabilities
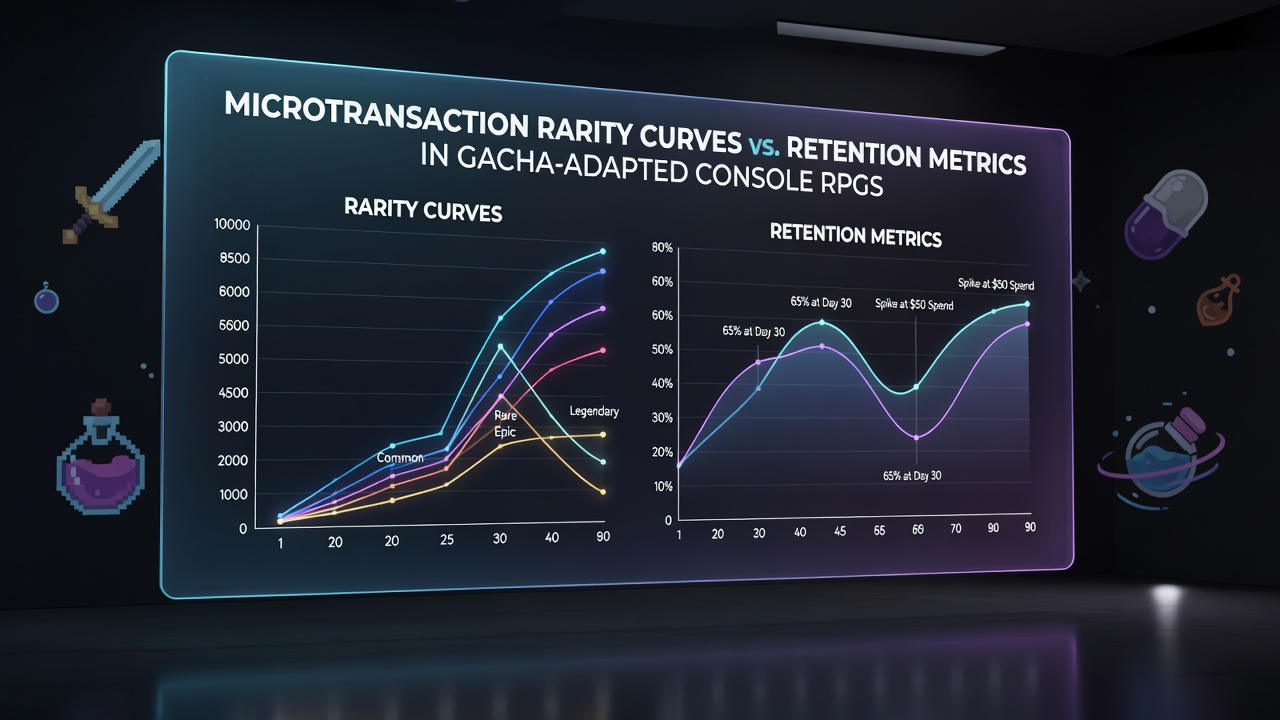
Retention metrics include metrics such as day-one return rates, 7-day active user percentages and lifetime session averages and these numbers move in tandem with rarity curve steepness when developers publish patch notes that detail probability adjustments. Data indicates that ultra-rare item probabilities below 1 percent often coincide with retention dips after the first month unless offset by guaranteed reward milestones while probabilities between 2 and 3 percent align with steadier player counts in both mobile and PC environments. Analysts compare these patterns by segmenting users into spenders and non-spenders to isolate how free-to-play progression speed interacts with paid pull incentives.
Platform-Specific Variations in Adaptation
Mobile versions frequently feature shorter session bursts tied to energy systems and push notifications that prompt immediate reactions to new banners while PC adaptations extend play windows through larger world maps and controller-optimized interfaces and these structural differences affect how rarity curves translate into sustained logins. Evidence from industry reports shows mobile retention curves flattening earlier when pity counters reset too frequently whereas PC titles maintain higher multi-week engagement when rarity updates coincide with story expansions that reward long-term account investment.
Case Examples from Recent Title Ports
One developer adjusted rarity weighting in a console port of a popular mobile gacha RPG during spring 2026 and subsequent telemetry revealed a 12 percent lift in 14-day retention among players who completed initial story arcs after the change and similar experiments on PC demonstrated that combining visual upgrades with adjusted drop tables produced parallel gains in average session duration. Another title tracked cross-platform cohorts and found that players who transferred accounts from mobile to PC exhibited slower initial spending yet higher overall retention once they encountered PC-exclusive events that featured modified rarity schedules.
According to findings published by the Entertainment Software Association, gacha mechanics adapted across hardware ecosystems show measurable ties between reward distribution and continued play and separate analysis from Canadian research groups has corroborated these platform variances through aggregated anonymized datasets.
Analytical Approaches and Visualization Techniques
Teams employ regression models that plot rarity probability against retention percentages to identify inflection points where small probability shifts yield larger engagement changes and heatmaps layered over time-series data help isolate seasonal effects such as holiday events that temporarily boost both metrics. Observers note that combining these visualizations with cohort analysis separates new player behavior from veteran patterns and reveals whether rarity curve modifications primarily attract fresh users or retain existing ones across mobile storefronts and PC distribution platforms.
Regulatory Context and Reporting Standards
Regional guidelines encourage transparent disclosure of drop rates in many markets and developers publish probability tables that feed directly into the rarity curve calculations used for retention tracking and compliance reports submitted to bodies such as the Australian Competition and Consumer Commission outline how these disclosures influence player decision-making patterns. Such reporting frameworks provide standardized data points that researchers then align with retention figures to assess broader market trends without relying on individual title anecdotes.
Conclusion
Tracing microtransaction rarity curves against retention metrics supplies developers with quantitative signals that guide iterative design choices in gacha-adapted console RPGs and the resulting insights span mobile and PC platforms where differences in session structure and update cadence shape how probability adjustments affect long-term player presence. Continued monitoring through established telemetry pipelines and cross-referenced industry datasets supports consistent evaluation of these relationships as titles evolve through post-launch support cycles.